@Royal_Arse Asks

Nature, Sports, & Money: Cycles of Life.

Tag: SPY

Equity Style Variance As Tool for Tactical Asset Allocation

Image

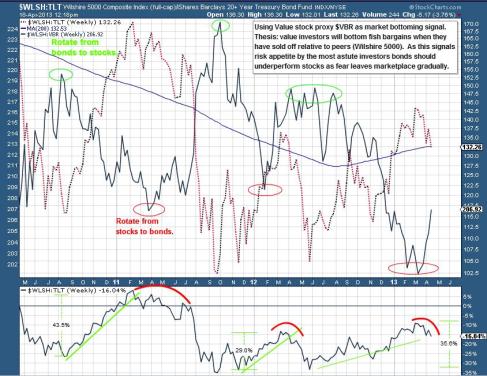
There is plenty to observe in this chart. The primary thesis is summarized in the top right hand side: does buying by value investors (relative to all stock investors) indicate a high likelihood of stocks outperforming bonds? Over the past three years there is some evidence that eager buyers of value stocks signal bottoming in broader stock market, thus sell bonds, buy stocks.

Hot Money & Glacial Migration: US GDP to Melt Your Face Off…Slowly

Regardless of their style smart investors take great care in knowing how the Worlds’ largest economies are functioning at a given time.  Whether you accept the Euro crisis as being wholly unresolved or not, the upcoming volatility will erode economic strength as if leaves were dropping off malignant trees throughout Europe.  The blight of debris covering the underlying soil will smother the growing buds with the haste and devastation of a German Autumn-turned-Winter.

However, drawing from recent history I expect the reverberations to be dampened in the near-term (H12012) as bailout cash is bazooked, firehosed and helicoptered onto Greece via the ECB, which should allow the USA to grow modestly in the interim.  For more on a troubled Europe see this recent analysis from Robert Sinn, the remainder of this post will focus on potential for growth in the US in spite of headline risk elsewhere.

Jelly Bean Jar Contest: Guess the Sum

2011 IMF estimates for Global GDP (nominal, $USD) show the Eurozone controls ~1/4 of the global economic activity ($17 Trillion annually; 25.65% of Global), with the USA close behind producing over 1/5  ($15 Trillion ann., 21.5% share)

Much like Wall Street forecasters, I expect H1 2012 to be slightly positive for the US economy (1.5-2% growth) and there are numerous reasons for this:

  • Election Year + Normal positive seasonality
  • Tepid Inflation
  • Healthy trends in employment and industrial production (expanding PMIs)
  • Rotation into growthy sectors, commodity strength on back of soft-landed China?

Additionally, we are 5-to-6 years deep into the US housing crisis and finally seeing some ‘Green Shoots’:  Construction spending is no longer declining and initial unemployment claims continues to leak lower.  Most experts are in agreement that there is no longer significant downside risks to residential housing.

US Total Construction Spending  Chart


This screen shows many in the General Building Materials category are performing respectably in H22011, a trend that should accelerate in H12012 assuming slow, but positive growth manifests itself in the US economy.

We also have indications of growth coming in the form of increased basic materials prices, which traditionally occurs concurrently with positive returns for stocks: http://chart.ly/p4ukkkh

The increase in commodity prices may be attributable to sector rotation as asset managers bail on their high-yielding dividend stocks for more growth-oriented fare.  Whatever the explanation risk appetite is being priced into the market.

The risks are clear: any slip up in Europe causing significant distress to the financial system and subsequently confidence render the above data null.  However, many smart macroeconomic analysts are constructive, if not outright bullish, on the US economy near term and the bearishness coming out of Europe shouldn’t fully dissuade risk-taking activities across the pond.

Related/Sources: 

Robert Sinn: “Sage Weekly Letter” — http://www.robertsinn.com/2012/01/08/sage-weekly-letter-9/

US Total Construction Spending Chart by YCharts

Bloomberg EconBrief — http://chart.ly/users/EconBrief

Wikipedia – IMF Global GDP forecasts http://en.wikipedia.org/wiki/List_of_countries_by_GDP_(nominal)


What Caused the August 2011 Panic? The Damn Europeans

So much ink has been spilled explaining the causes of crises over time that another iron in the fire is welcomed (if to only displace one of the others amongst the crowded indiscernible pile).

This time is different, so we’re led to believe, because debt levels are excessive on both public and private balance sheet.  So overtaxed by these burdens is the developed Western world that governments have opted for an eyes-wide-shut solution: make up new rules.

The rule in question was proposed was by newly appointed Chairman of the “International Accounting Standards Board”  Hans Hoogervorst.  Mr. Hoogervorst suggested a solution to the European debt problem that closely resembles the solution to the panic of 2008: suspend Mark-to-Market accounting (of sovereign debt on Euro bank balance sheets and companies listed in the EU).

Discussing the parallels to the USA’08-09 and EU’11  Jason Schwartz writes (emphasis added):

“Mark-to-market was repealed at 8:45 a.m on April 2, 2009, which finally put a stop to the short term liquidity crisis … Banks no longer had to raise capital as long term stability was brought back to the system.  The exact same scenario would have happened in 2011 Europe under Hoogervorst’s plan. Without the threat of failure by those banks who hold high amounts of euro sovereign debt, investors would be free to move on from the European crisis and the stock market could resume its fundamental course.”

During a panic, Mark-to-Market forces liquidation of holdings in order to satisfy the collateral requirements of counterparties.  When everyone has this issue, margin-call-like forced liquidations are like the tide going out: it lowers all ships in the Harbour as cash is raised as quickly as possible, often without tactical discretion.   Mr. Hoogervorst describes the importance of this rule (IFRS 9) and its impacts on markets as follows: 

“Under IFRS 9, impairments will still be painful but I am convinced it would be more timely done because the cliff effect is much less severe,”

The premise is one the financial community is very familiar with: lets make life a little easier for the banks and relieve some potential stress from our already taxed system (in the absence of the appetite or wherewithal to write-down the bad debts).  Moral hazard aside this seems reasonable given current economic conditions and the lustful bedfellows banks and big government.  

However, a voracious opponent to this approach has emerged and on August 4th 2011 announced that Jan 2015 would be the earliest implementation date.

We have been in a panic ever since.  http://chart.ly/pyd78w6 HT @traderstewie . How does this end?  Who knows.  Markets will bounce around and if they aren’t closing higher by the weeks end, well then they’ll be closing lower.

What I do know is that tinkering with the rules of engagement by big brother always has unintended consequences.  This time around it caused trillions in paper losses within a week and forced Gold up to $1800 per oz.  These risk-off assets are soaring against their own fundamentals (UST’s rally) due to fear.  Greed will step in eventually.  For more perspective see this video from @chessNwine from iBC .

Bearish on the US Economy Yet? FED Beige Book and One Great Chart

As far as economic forecasts are concerned the Beige Book from the US Federal Reserve offers some pretty telling info (remember the US economy is not the Global markets).
US Economic Executive Summary:

Job growth is weak, income is flat and credit demand is weak; as such residential real estate still in decline. Meanwhile, Consumer spending modestly improved, prices have been decreased (vs. previous Month) for certain goods, cheifly gas/oil. In sum, today’s Beige Book report “implied little abatement of the still sizeable unused capacity in the economy. Thus, the report implicitly continues to argue for maintaining the current highly stimulative monetary conditions.”  Low rates for a long time.

Doesn’t strike you as a particularly bullish report?  Allow @gtotoy to provide some perspective here: http://chart.ly/v7wvk5m

Contrasting the two leaves me thinking this Summer 2011 lull in the markets is indeed the ‘mid-cycle slowdown’ pundits have mentioned ad nauseum.  For more long term perspective, how about a 20-year chart of $SPX from @Xiphos_Trading : http://chart.ly/geuksff 

With all of the stimulus and accomodative government action (ie the EU teeing-up a Can for the Kicking; ZIRP) how could we not re-test $SPY 1500.  If we don’t see it on 2011, we’ll get there for Spring 2012 during the pre-election frenzy.  Obama needs something to get his ass reelected.  

For more Beige Book, here is a point-form Summary:

– U.S. Beige Book indicates greater moderation in growth
– Today’s Beige Book report indicated a weaker economic environment relative to June policy meeting. Specifically, the pace (of growth) moderated in 8 districts. In June, a moderation in growth was reported for 4 districts.
· Manufacturing activity continued to expand overall (steady to slowing growth). Some districts reported fewer supply problems to auto production that originated from the natural disasters in Japan.
· US Residential real estate activity was little changed remaining at still very weak levels. Non-residential real estate activity improved in six districts (Commerical real estate doing better as businesses are healthy overall).
· Disappointingly, loan demand was mixed: loan volumes decreasing in St. Louis and Kansas City partially offset strengthening demand in New York, Richmond, and Chicago.
· Agriculture was hit by both drought conditions in four districts and flooding in two districts.
· modest consumer spending growth in a majority of districts thanks to falling gas prices. Most of the improvement was in non-auto retail sales
· The energy sector remained strong with the Beige Book highlighting shale exploration in the Atlanta and Cleveland Districts.
· although most districts saw modest hiring increases, labour market is soft. With high unemployment persisting, it was reported that wage pressure remained subdued in most occupations (aka income is flat; want to see this rising!)
· Overall price pressures were reported to have moderated somewhat consistent with a slightly weaker assessment of the economic growth (less growth, less demand, better prices, more demand, more growth, higher prices, less demand/growth, rinse recycle repeat)

SOURCE: RBC ECONOMICS RESEARCH – DAILY ECONOMIC UPDATE – July 27, 2011